
Insights
Look at any figure of the business over days, weeks or months, filter it by tag, forecast what comes next, and open the report behind each period.
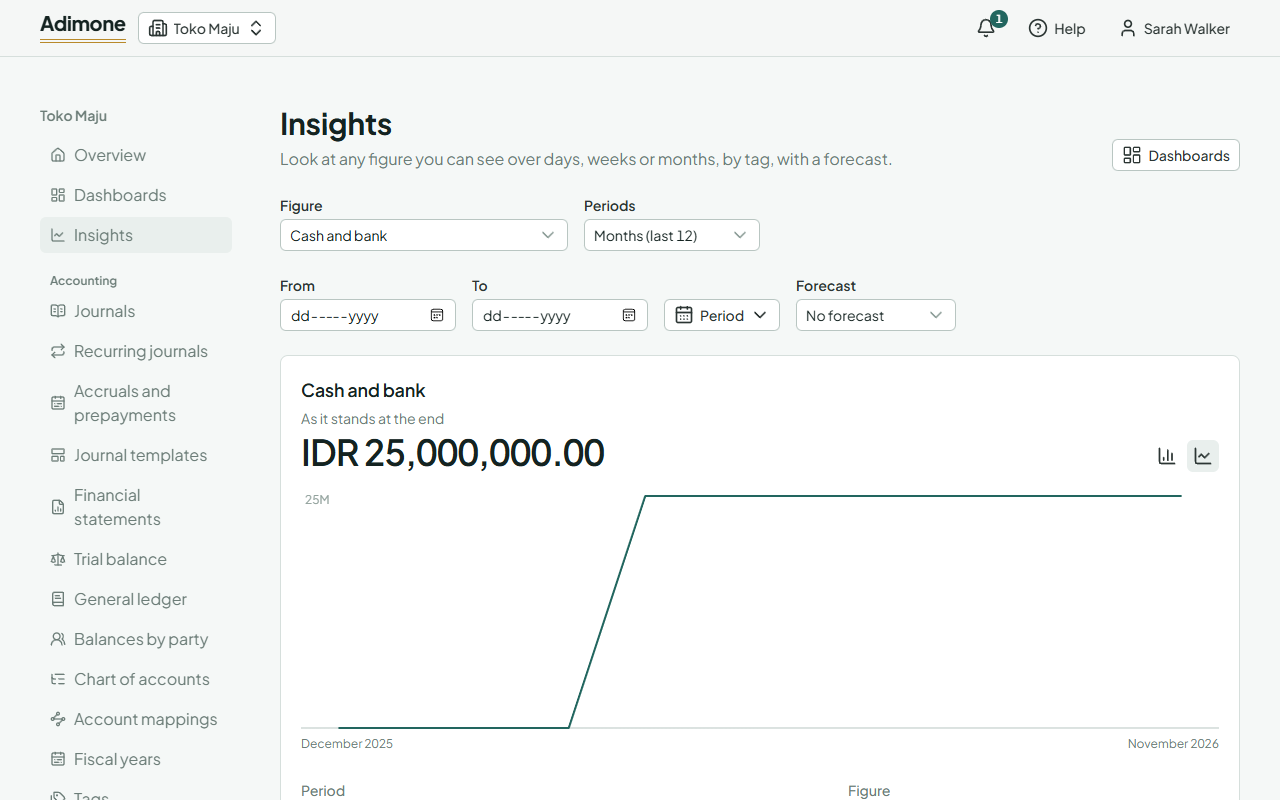
Insights shows one figure at a time in full: its history as a chart and a table, a total, and if you ask, a forecast. It covers every figure your role lets you see, the same ones the dashboards show.
Open Insights, or choose a figure's name on a dashboard to open it here.
Look at a figure
- Pick the Figure.
- Pick the Periods: days, weeks or months.
- Pick the dates under From and To, or choose one under Period. Without dates you see the last 30 days, 13 weeks or 12 months.
- For revenue, expenses and net income, choose tag values under Tags to keep only what was tagged with them.
The large figure is the total over the periods for a figure that adds up over time, such as revenue, or the balance at the end for one that stands at a moment, such as cash and bank. Switch the chart between bars and a line with the buttons beside it.
The table lists each period, newest first. Its link opens the report behind the figure for that period, such as the income statement for that month.
Some figures look at the days ahead, such as the projected lowest cash over the next 30 days; they show as one number, and their link opens the cash forecast. Figures that come with plans that include insights are listed with a lock until the plan has them.
Ratios
With a plan that includes insights, the figures also include ratios from your books:
- Working capital, current ratio and quick ratio: whether what you hold for the coming months covers what you owe in them.
- Debt to equity: what you owe against what the business is worth to its owners.
- Interest coverage: how many times the profit before interest and income tax covers the interest. It counts the accounts with the subtype Interest expense; if your chart keeps interest under other expenses, there is no figure until you give that account the subtype in the chart of accounts.
- Gross, operating and net margin, return on assets and return on equity, in percent.
- Days sales outstanding, days inventory outstanding, days payables outstanding and the cash conversion cycle: how many days customers take to pay, stock waits to be sold, you take to pay, and the cash is tied up in between.
A ratio shows "—" for a period when what it divides by is zero or less, such as a margin in a month without sales. Alerts on a ratio take the threshold in the ratio's own unit: times, percent or days.
Forecasts
Choose how many periods to Forecast. The forecast continues from the last whole period, drawn dashed, with a shaded band where the figure is likely to fall (about 19 times in 20). Forecasts use plain statistics from the figure's own history:
- Moving average: the average of recent periods.
- Linear trend: a straight line through the history.
- Seasonal (Holt-Winters): the trend with a pattern that repeats each year (or each week, by day).
Best fit picks the method that followed the history most closely. Under the chart you see the method used and how far off it was on past periods on average. With too little history there is no forecast yet.
A forecast only extends what happened before. It doesn't know about a new contract or a price rise, so read it as a guide.